If you just pulled up your Shopify analytics and saw a cart abandonment rate somewhere in the high 60s or 70s, take a breath. You haven't broken your store. You've found the industry median.
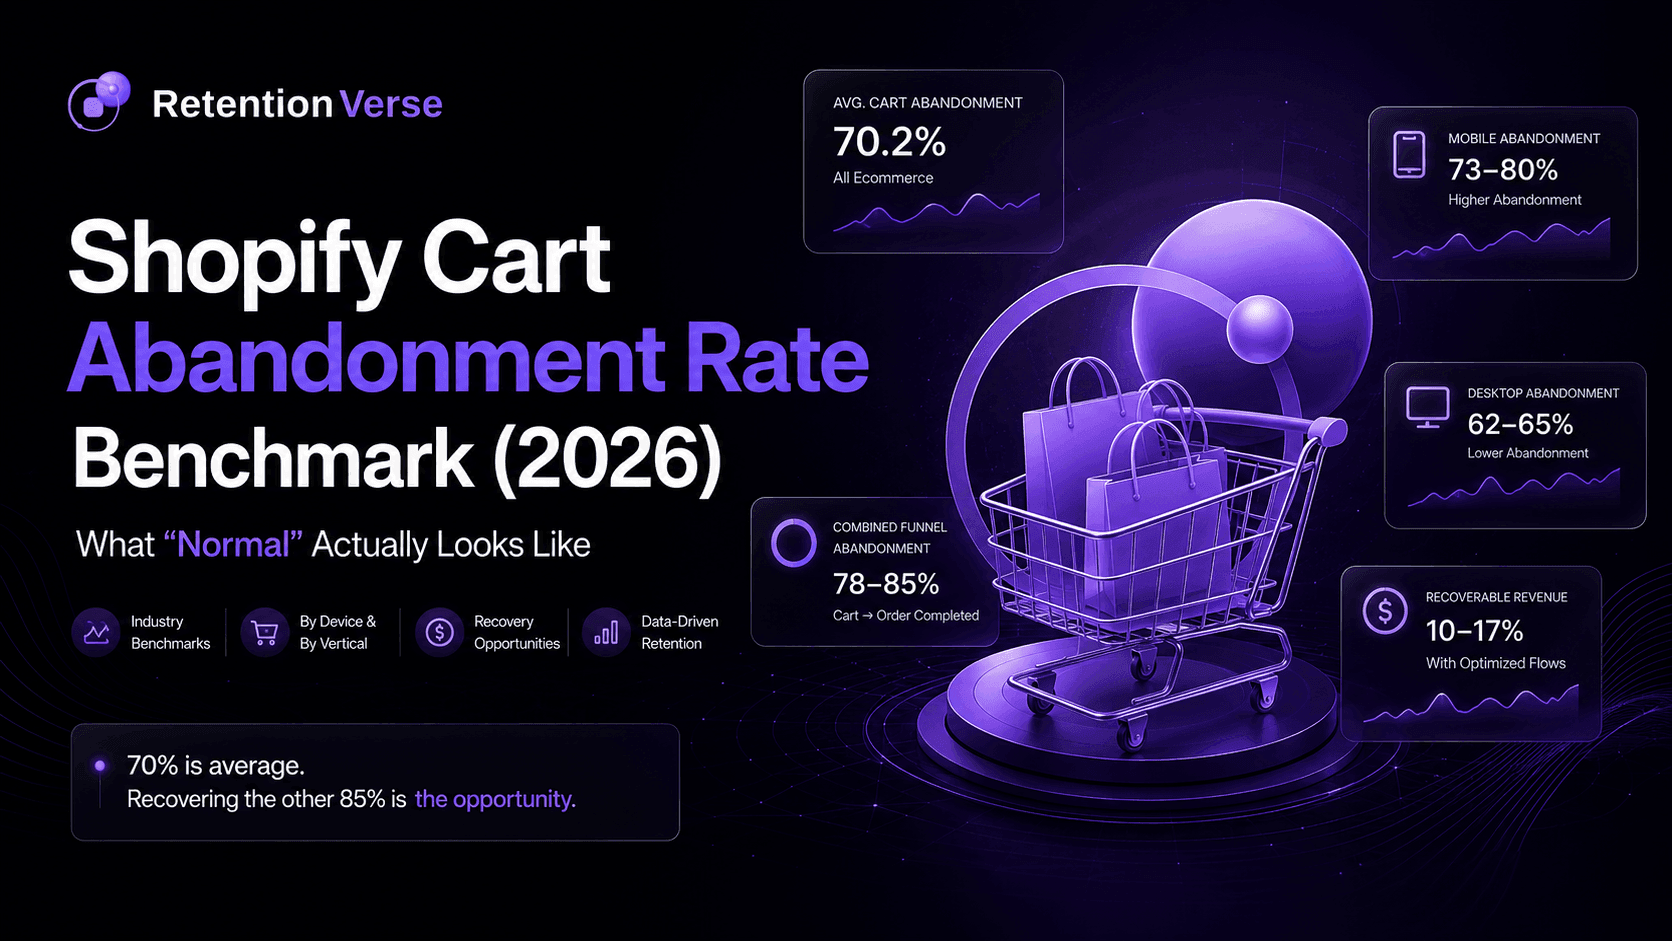
The average Shopify cart abandonment rate sits at roughly 70% — meaning about seven out of every ten shoppers who add a product to their cart leave before paying. That number has barely moved in over a decade of checkout redesigns, one-click payments, and "optimized" funnels. It's not a bug in your store. It's closer to a law of ecommerce physics.
The real question isn't "why is my abandonment rate 70%?" It's: where do I sit against my device mix and vertical, and how much of that 70% is actually recoverable? That's what this benchmark answers.
The Headline Benchmark
| Metric | 2026 Benchmark |
|---|---|
| Average cart abandonment rate (all ecommerce) | ~70.2% |
| Shopify-specific cart-to-checkout abandonment | 65–72% |
| Well-optimized Shopify stores | 55–65% |
| Sub-50% abandonment | Rare — requires checkout optimization and aggressive recovery |
| Desktop abandonment | ~62–65% |
| Mobile abandonment | ~73–80% |
| Combined funnel abandonment (cart → completed order) | 78–85% |
The takeaway most merchants miss: checkout abandonment and cart abandonment are two different metrics. Cart abandonment measures everyone who added a product but never started checkout. Checkout abandonment measures the smaller group who started checkout and still didn't finish. Stacked together, the combined funnel leak is closer to 80%+ — which is why a store can have a "good" cart abandonment number and still be leaking significant revenue at the final step.
Benchmark by Device: Mobile Is Where the Damage Happens
Mobile now drives the majority of Shopify traffic, and mobile is also where abandonment is worst.
| Device | Abandonment Rate |
|---|---|
| Mobile | 73–80% |
| Desktop | 62–68% |
| Gap | 10–15 percentage points |
Since mobile traffic typically makes up 60%+ of visits for a DTC brand, mobile abandonment accounts for the large majority of total lost carts — even though the desktop rate looks "better" on paper. If your recovery strategy isn't built mobile-first (fast-loading flows, thumb-friendly checkout, SMS alongside email), you're optimizing for the smaller half of the problem.
Benchmark by Vertical: Don't Compare Yourself to the Wrong Store
The 70% average is a blend. Individual categories swing from the mid-40s to the low 90s depending on price point, consideration time, and purchase urgency.
| Vertical | Approx. Abandonment Rate |
|---|---|
| Grocery / consumables | ~61% |
| Apparel & accessories | ~68–72% |
| Beauty & personal care | ~68–73% |
| Home & furniture | ~75–80% |
| Luxury / high-ticket goods | ~80–91% |
| Electronics | ~75–82% |
A luxury jewelry brand sitting at 78% may be performing well for its category, while a consumables brand at the same 78% has a real problem. Benchmark against your vertical median first — the blended 70% figure is a starting point, not a scorecard.
What "Good" Actually Looks Like for a Shopify Store
There's no universal "good" number — but there is a realistic performance ladder:
- 70%+ — Industry average. Nothing broken, but nothing captured either.
- 60–70% — Solid. Usually reflects transparent shipping costs, guest checkout, and at least one recovery flow live.
- 55–65% — Well-optimized. Typically the result of Shop Pay adoption, accelerated checkout, and a multi-touch email + SMS recovery sequence.
- Below 50% — Rare, and it isn't achieved through checkout tweaks alone. It requires pairing on-site friction removal with aggressive, well-timed lifecycle recovery — the kind built in Klaviyo, not a default abandoned-cart template.
Why the 70% Number Refuses to Move
This is the part most "10 tips to reduce cart abandonment" articles skip: the majority of cart abandonment isn't a checkout problem at all.
Baymard Institute's research and Shopify's own merchant data consistently point to the same top reasons, in roughly this order:
| Reason for Abandonment | Approx. Share of Abandoners |
|---|---|
| Unexpected costs (shipping, taxes, fees) | ~47–48% |
| Forced account creation | ~25–26% |
| Delivery too slow | ~24% |
| Didn't trust the site with payment info | ~19% |
| Checkout process too long or complicated | ~18–22% |
Notice that four of the five top reasons are research behavior, not rejection — a shopper comparing shipping costs across tabs, checking if a coupon exists, or simply not being ready to buy yet. That's not a checkout bug. That's a shopper who needs to be brought back with the right message at the right time — which is a lifecycle marketing problem, not a UX problem.
This is exactly why checkout optimization alone plateaus around the mid-60% range. The remaining gap belongs to email, SMS, and on-site retargeting.
Recovery Benchmarks: What a Good Klaviyo Flow Actually Recovers
Once a cart is abandoned, the flow that brings it back is where agencies earn their fee. Current benchmarks for a properly built abandoned cart flow:
| Metric | Benchmark |
|---|---|
| Abandoned cart flow open rate | ~50–52% |
| Click rate | ~6–6.5% |
| Flow conversion rate | ~3–3.5% |
| Revenue per recipient | ~$2.50–$3.00 |
| Carts recovered by a 3-email sequence | ~10–17% |
| Native platform identification coverage | ~15% of abandoners (the other 85% never receive a recovery email at all, because they were never identified) |
That last line is the number that should actually concern a Shopify founder more than the 70% headline stat. Most stores are only ever able to email 15% of the people who abandon a cart, because a default Shopify/Klaviyo setup can't match an anonymous browsing session to an email address unless the shopper already reached checkout or is a known subscriber. The other 85% simply disappear from the funnel — not because the flow underperforms, but because the flow never gets triggered.
How to Calculate Your Own Cart Abandonment Rate
Cart Abandonment Rate = 1 − (Completed Orders ÷ Carts Created) × 100
Example: if your store had 4,000 carts created last month and 1,100 resulted in a completed order:
1 − (1,100 ÷ 4,000) = 0.725 → 72.5% abandonment rate
Pull this from Shopify Analytics (Behaviour → Cart reached checkout / Sessions converted) or from your Klaviyo "Placed Order" vs. "Started Checkout" metric comparison. Segment it by device and by new vs. returning visitors before you draw any conclusions — a blended number hides which half of your funnel actually needs work.
The Real Opportunity Isn't Lowering 70% — It's Capturing the Other 85%
Most merchants read a cart abandonment article and walk away trying to shave a few points off the headline number with a shipping bar or a progress indicator. Those help — but they're fighting for single-digit gains inside a number that has stayed flat for twenty years for a reason: a large share of abandonment is simply shoppers who haven't decided yet.
The bigger, largely untapped lever is recovery coverage — the 85% of abandoners who currently never receive a single email because they were never identified in the first place. Closing that gap is a lifecycle marketing and Klaviyo infrastructure problem: visitor identification, multi-channel recovery (email + SMS + on-site), and flow logic that adjusts messaging based on cart value, product category, and channel — not a one-size-fits-all "you left something in your cart" template.
This is the exact gap RetentionVerse is built to close for Shopify and DTC brands: auditing where your recovery coverage actually breaks down, rebuilding the abandoned cart, checkout, and browse abandonment flows in Klaviyo around real segmentation, and layering in the identification and timing logic most default setups never touch.
If your store is sitting at or above the 70% benchmark with no full recovery sequence live, that gap is quantifiable — and recoverable.
👉 Get a free Klaviyo & retention audit from RetentionVerse — we'll show you exactly how much of your abandoned cart revenue is currently unrecovered, and what closing that gap is worth per month.
FAQs
What is a good cart abandonment rate for Shopify? Anywhere from 55–65% is considered strong performance for most verticals. The 70% mark is the industry average, not a red flag on its own — but it does mean there's very likely unrecovered revenue sitting in your flows.
Why is my Shopify cart abandonment rate so high? In most cases it isn't uniquely high — it's close to the 65–72% range every Shopify store sees. The bigger question is whether your recovery flows are capturing the identifiable share of those abandoners, since native tools typically only reach about 15% of them.
Does Shopify have a lower abandonment rate than other platforms? Slightly. Shop Pay and accelerated checkout tend to put Shopify stores a few points below the broader ecommerce average, particularly for returning customers who have Shop Pay saved.
How much revenue is recoverable from abandoned carts? Based on current flow benchmarks, a well-built 3-email abandoned cart sequence recovers roughly 10–17% of abandoned carts, at close to $3 revenue per recipient. For a $50K/month store, that typically represents $11,000–$25,000/month in recoverable revenue currently being left on the table.
What's the difference between cart abandonment and checkout abandonment? Cart abandonment is anyone who added a product but never started checkout. Checkout abandonment is the smaller group who started checkout and still left. Combined, total funnel leakage from "added to cart" to "completed order" typically runs 78–85%.
Sources referenced: Baymard Institute cart abandonment research; Shopify merchant data; Klaviyo 2026 Abandoned Cart Benchmark Report; Dynamic Yield device benchmarks.
Written by
Mayur Sadar
Retention Specialist · RetentionVerse
Expert in email & SMS retention systems that turn one-time buyers into loyal, high-LTV customers.